NOTICE: Certain links on this post may earn a commission for Western Hunter Magazine from Amazon or our other affiliate partners when you make a purchase. Thank you for your support.
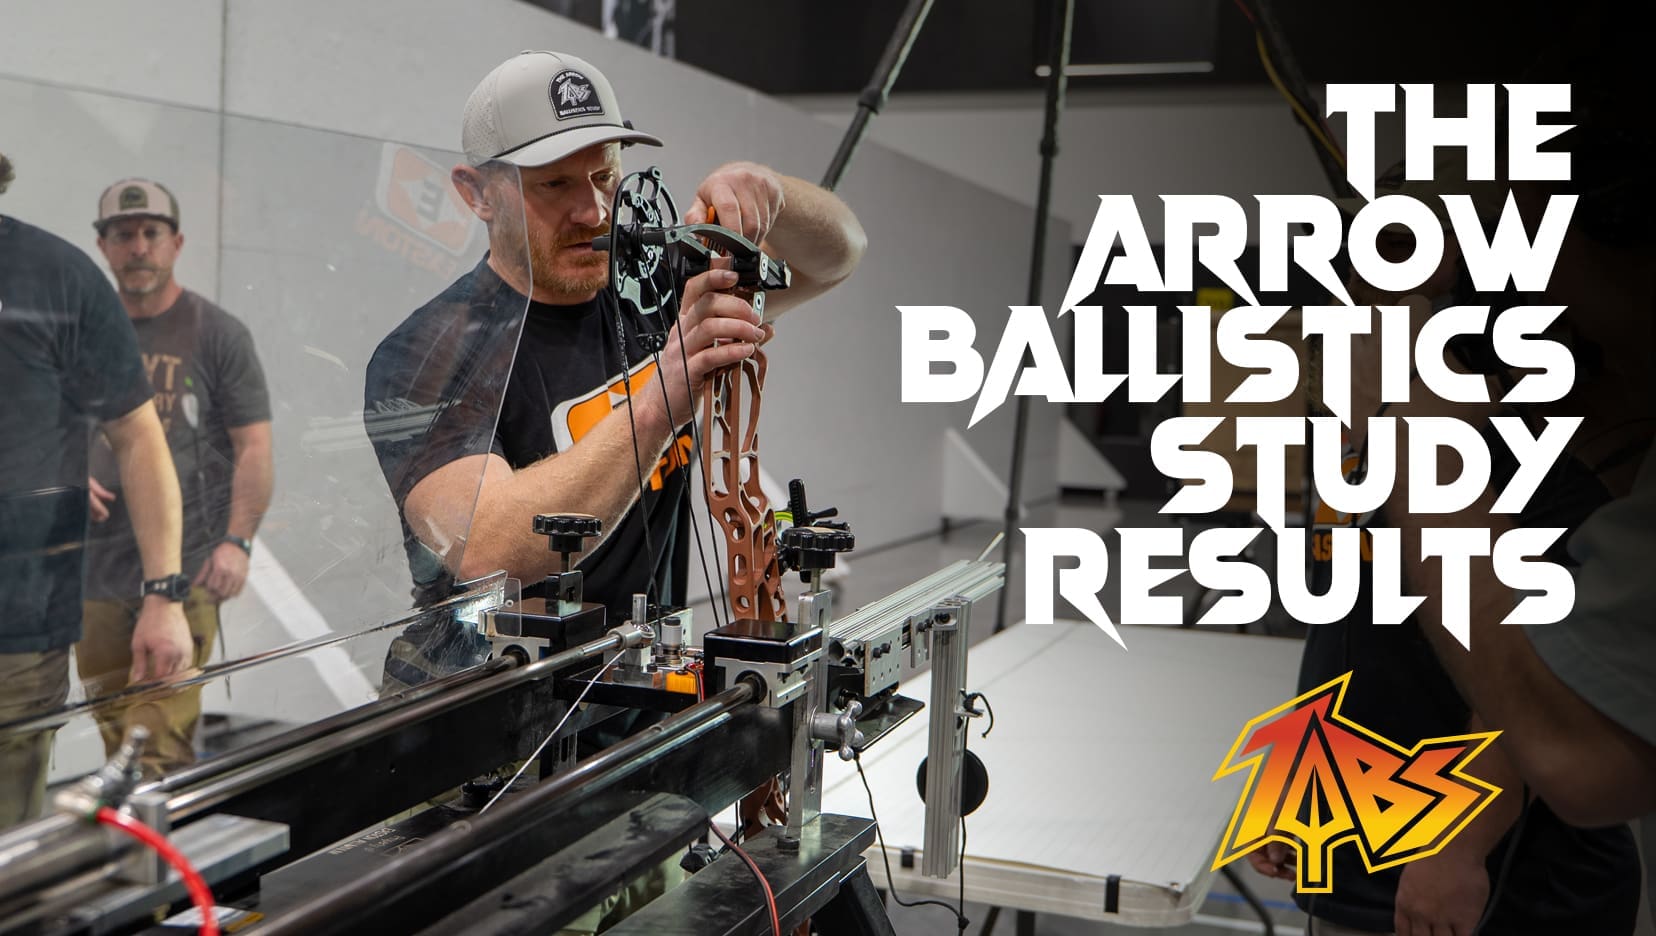
The 2026 Arrow Ballistics Study RESULTS
Introduction
Here we go, round 2 of The Arrow Ballistics Study! This study series is truly the first of its kind answering hotly debated questions in the industry about front of center FOC, drag, and lift recovery (the arrow’s ability to correct itself in flight) across a wide range of vanes, broadheads, and shafts. If you want to learn how to make the most accurate and forgiving arrow setup possible (most likely to hit where you are aiming even if you make a shooting mistake while out hunting), you need to tune into these results. This Study has incredible information for the first year newbie all the way up to the seasoned pro. I thought there was a lot of hype about the study last year, but man the excitement and anticipation for the 2026 Study has been through the roof. I thank everyone for their support and kind comments. I feel like we just scratched the surface in the 2025 Study and there is so much more to test and learn. I am excited to present the results of the 2026 Arrow Ballistics Study here and continue these studies into the future.
The 2026 Study builds on the 2025 Study with more vane and broadhead testing and introduces a brand new experimental protocol testing arrow front of center, FOC, which is one of the most hotly debated subjects in the archery community. FOC is the measure of how much of an arrow’s mass (think point weight) sits forward of the arrow’s balance point (essentially the weight distribution of the arrow).
If you are new to The Arrow Ballistics Study a few other things to check out: please review the blog article from the 2025 Study, here.
Also, check out The Arrow Ballistics Study playlist on my YouTube channel @yatesinthebackcountry
Lastly, you need to do yourself a favor and check out the main repository of study results at Precision Cut Archery.
Click here to check out the fundraiser and $15,500 Giveaway for the Study
The high level premise of The Arrow Ballistics Study is to gain a science-based understanding of the fundamental governing aspects of arrow external ballistics in a controlled environment and consistent experiment protocols. In particular, to study how an arrow’s build components (vane configuration, arrow length, arrow diameter, point/broadhead, and FOC) affect ballistic properties such as aerodynamic drag, downrange accuracy, and corrective lift (how quickly an out-of-tune arrow corrects itself) and therefore, how an arrow build can be optimized (or made more forgiving) for specific purposes, such as hunting different species and various target archery events. Just like last year, we’ve captured great comparative results independent of commercial bias.
Assembling the Perfect Team
Just like last year, to execute a project of this magnitude and sophistication it took a major team effort. Tristan from Precision Cut Archery has been a partner of mine since I first came up with the concept of this study a couple of years ago. He and his team came back better than ever and brought major value in collecting and organizing the data during the study event, as well as data processing (requiring software coding), statistics/regression analysis and creating really cool interactive plots (I mean really cool). When you have finished reading this article you need to check out the Study section of the Precision Cut Archery website if you haven’t already, here. The simple plots shown in this article are next level on the PCA website because they are interactive! You can actually hover over the dots in the plots to pop up specific data and even click on the dots to see the actual photos of the arrow groups that the data were pulled from. It’s absolutely epic! Tristan has spent an insane amount of time building out the results webpages and this study would not be possible without his major contributions!
Like last year, we needed some major muscle to get this project done. Easton was eager to help yet again, and this project would simply not be possible without them as a team member. Easton provided primary funding, arrow shafts, a precision shooting machine, engineering support, media/content coverage, dedicated lab time in the Easton Lab, and coordinated the Study venue for long range controlled shooting. Their generous contribution was truly a selfless act for the advancement of archery.
Hoyt chipped in big time this year, helping with funding and donating four AX-3 33 test bows used throughout the 2026 Study. Their XTS tuning system was a pivotal bow feature to streamline the tuning effort at the Study. Hoyt provided personnel support and media coverage as well.
Jace Johnson is the man behind the arrows. Jace personally fletched every single arrow in the 2025 and 2026 Studies (nearly 1,000 arrows) to a very high standard.
Sound analytics were conducted by Jaime at Archery Sound Lab, using a purpose built sound chamber. He has a degree in acoustics and is a very passionate archer.
Sponsors
The 2026 Study was about 3 times bigger and massively more involved than the 2025 Study. Huge thank you to the sponsors of the Study this year. These companies donated product, expertise, and funding to help make this Study possible. Please support these companies.
A few Definitions
I am not going to fully get into the methods and definitions rigmarole that I went over in last year’s article (or they are also posted on the Precision Cut Archery Website). Again, if you are new to the Study, you should read the 2025 article, here. A few reminders though… Drag and arrow corrective lift are two different things. Drag is bad, it’s the force that opposes the forward motion of the arrow. Corrective lift is good, it’s the force that corrects the arrow in flight if there are any angular deviations (think about the arrow coming out of the bow a little cockeyed). In an ideal world the perfect arrow design would maximize lift and minimize drag. In fact, a BIG reason for this study is to determine what vane shapes and fletching configurations minimize drag while maximizing lift. Well, its not just the vanes that help promote better lift recovery of the arrow; it’s the FOC as well.
A couple of new topics that I didn’t discuss last year. Getting an arrow to recover quickly comes down to two key points about the arrow. One is called the center of mass, and the other is called the center of pressure. Physically on the arrow, there is a balance point from front to back. It’s easy to find this point balancing the arrow on your index finger. This point where the arrow balances is called the center of mass. It falls on the forward half of the arrow. The weight distribution of the arrow is largely based on how many grains per inch (GPI) the shaft weighs, how heavy the vanes and nock are, and how much front weight (insert, broadhead, etc.) there is. Adding point weight moves this balance point forward. This is the concept of increasing FOC.
The other point that defines the stability of the arrow is called the center of pressure. The center of pressure is more abstract to think about, but it exists all the same. This point can’t physically be found by balancing the arrow with your finger. Think about sticking your arm out of a fast moving car and feeling the pressure of the air on your arm. If you point your fingers up or down, you can change how the pressure distributes along your arm. With an arrow it’s the same thing. Think about the pressure that the broadhead sees, the shaft, and the vanes whizzing through the air. The balance point of that pressure (or center of that pressure) is some point on the shaft between the vanes and the broadhead. This point should fall on the back half of the arrow because the vanes see more pressure than anything else on the arrow (or at least they should).
So, the center of mass is in front of the center of pressure. Now, what really drives the stability of the arrow is the distance between these two points. The center of pressure being behind the center of mass provides the leverage or torque necessary for the arrow (represented by the center of mass) to correct itself. The longer the distance between these two points, the more leverage or torque the corrective lift has to quickly stabilize the arrow.
The practical application of these concepts has limitations, however; and one of the biggest limitations is the dynamic spine of the arrow. Think about dynamic spine as how much the arrow is flexing coming out of the bow. Increasing point weight will certainly increase stability in a perfect world but if the dynamic spine of the arrow is weakened too much this can degrade accuracy and forgiveness.
A Litte More Preamble
Before I deep dive into the results of this Study, there are a few things I need to mention first. This test is in no way shape or form intended to bash, call out, nor discredit any brand nor manufacturer. We have conducted this study to the best of our ability, budget, and time constraints. Tristan and I have done the bulk of the heavy lifting on this project, and it is not our day job. We have spent a stupid number of really late nights, holidays and weekends to pull this off. I’ll be the first to admit it’s not perfect and I wish we had more time to shoot more arrows of each design to get bigger sample sizes; I wish we could have varied arrow length and/or added a couple more GPI shaft categories for the FOC testing, but we did the best that we could with the resources and time that we had. There is no governing body who dictates how arrow ballistics are to be tested, so we have done things according to how we thought best.
Also, keep in mind that this study is analyzing arrow building concepts like fletching configurations, comparing broadheads and FOC’s, it’s not a comparative shaft brand test nor a comparative bow brand test. We could have used any brand of shaft or any bow to conduct this study. Since this study is about arrow building principles, the results are applicable to any shaft from any brand or any bow. I chose to work with Easton on this project because they have a strong company focus on education, they make very consistent shafts (consistency is very important to this study), and they have a lot of variety in their product line. I chose to work with Hoyt because I am very familiar with their bows, repeatable, and most importantly that new XTS tuning system is exactly what we needed to streamline and speed up the tuning process at the Study.
How the Study Was Conducted
Equipment Used in this Study
- Precision Cut Archery Software
- Easton 5.0 shafts, 5mm Axis shafts, and 5mm FMJ Max shafts
- Hoyt AX-3 33 bows
- Hamskea R7 rests
- Spot Hogg Boonie Sights
- Last Chance Archery Flightcheck Paper Tuner
- Last Chance Archery Pro Grain Scale 2.0
- Garmin Xero C1 Pro Chronographs
- Various vanes
- Various broadheads
Baseline Arrow Builds for Drag, Lift Recovery, and Sound Testing (Component) Testing
During the testing we had two baseline arrow designs to do the component testing at two different launch velocities (~290 FPS and ~325 FPS), which consisted of the following control components:
1. Arrow: 5mm Easton Axis (standard speed build, ~450 gr), Easton 5.0 (high speed build ~390 gr)
2. Arrow Length: 27” (carbon to carbon)
3. Consistent vane configuration for broadhead iterations: Three AAE Max Stealth, Bitzenburger Right Helical, 2° offset
4. Field Tip: 100 gr Gold Tip Ez-Pull Field Tip
5. Consistent fixed blade broadhead for vane iterations: 100 gr Iron Will Wide
6. Standard speed bow: Hoyt AX-3 33 28” draw length and 70# draw weight
7. High speed bow: Hoyt AX-3 33 29” daw length and 80# draw weight
Component Drag Constant
The first step in the study was calculating an arrow’s drag coefficient. This testing was conducted using the baseline arrow build with various vane configurations and tip/broadhead types. This was done by shooting each arrow out of a tuned Hoyt AX-3 33 using Easton’s Precision Shooting Machine. Doppler radar chronographs (Garmin Xero C1 Pro Chrono) were used to determine a launch velocity and a down range velocity (60 yards) for that arrow. Each unique arrow design was shot 12 times by the shooting machine. The velocity readings, arrow weights and launch parameters were fed into the PCA software to calculate a drag coefficient for that arrow. The shooting machine is critical to this study providing the control, ensuring that each arrow is shot the exact same way every time.
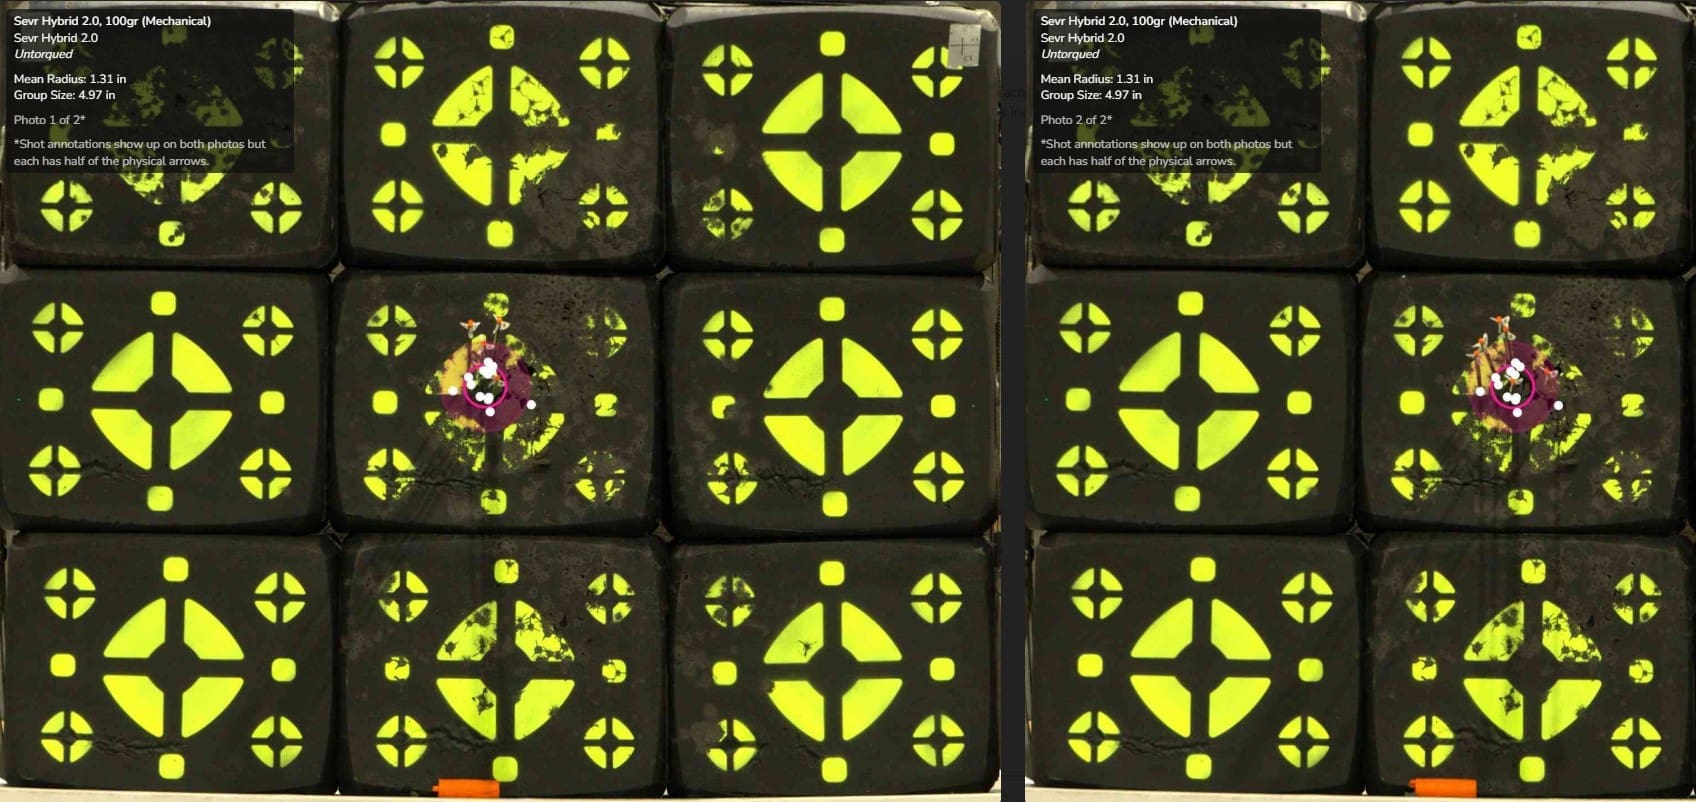
Pulling Data from Photos
A photo of each group of arrows was taken throughout the study and those photos can be viewed on the PCA website. Each arrow’s impact location data or arrow group size data used throughout these results were pulled from these photos with software developed for this study. More information about this process is available in the Methods section of the PCA website.
Lift Recovery
It’s nearly impossible to directly measure the corrective lift force in flight so we came up with a proxy method to estimate its effects. To estimate the effects of corrective lift (how the arrow recovers in flight) the bow was intentionally torqued 2 degrees horizontally in the shooting machine (torqued the exact same way for every shot) resulting in about a 0.9 inch paper tear at 15 ft. All fletching configurations were shot at 70 yards with a field point and fixed blade broadhead a total of 6 shots each. It would have been impossible to test every single broadhead with every single vane, so the testing team used an Ironwill Wide as the broadhead control. Since the bow was torqued, the arrows were launched with a horizontal misalignment, which forced the vanes to attempt to correct the arrow’s flight. Obviously the broadhead arrows drifted more than the field point arrows. The degree to which the vanes corrected (or did not correct) the arrow’s flight was quantified by measuring the difference between the broadhead arrow’s impact location and the field point arrow’s impact location. The impacts for all arrows were recorded with photos and then those photos were analyzed with software to extract impact coordinates. Comparatively, the greater the lift force of a particular fletching design, the lesser measured displacement between the fixed blade arrows and the field point arrows. This is a practical way of measuring the effects of the lift force for bowhunters.
Sound Testing
Sound testing for The Arrow Ballistics Study was independently conducted by The Archery Sound Lab, specializing in acoustics-testing of archery equipment. Testing was conducted in a purpose-built, shoot-through, sound chamber to isolate the arrow’s in flight sound signature from external sounds (including the noises from the bow firing and arrow impact). For example, the sound chamber achieves a very low sound floor of 22 dB, which is much lower than a normal ambient sound floor (40-50 dB). The Archery Sound Lab has a purpose-built shooting machine to go along with the sound chamber to ensure consistent arrow flight passed the microphone. For the complete methodology of the sound testing, check out the Sound Testing Methods page on the Precision Cut Archery website.
Baseline Arrow Builds for FOC Testing
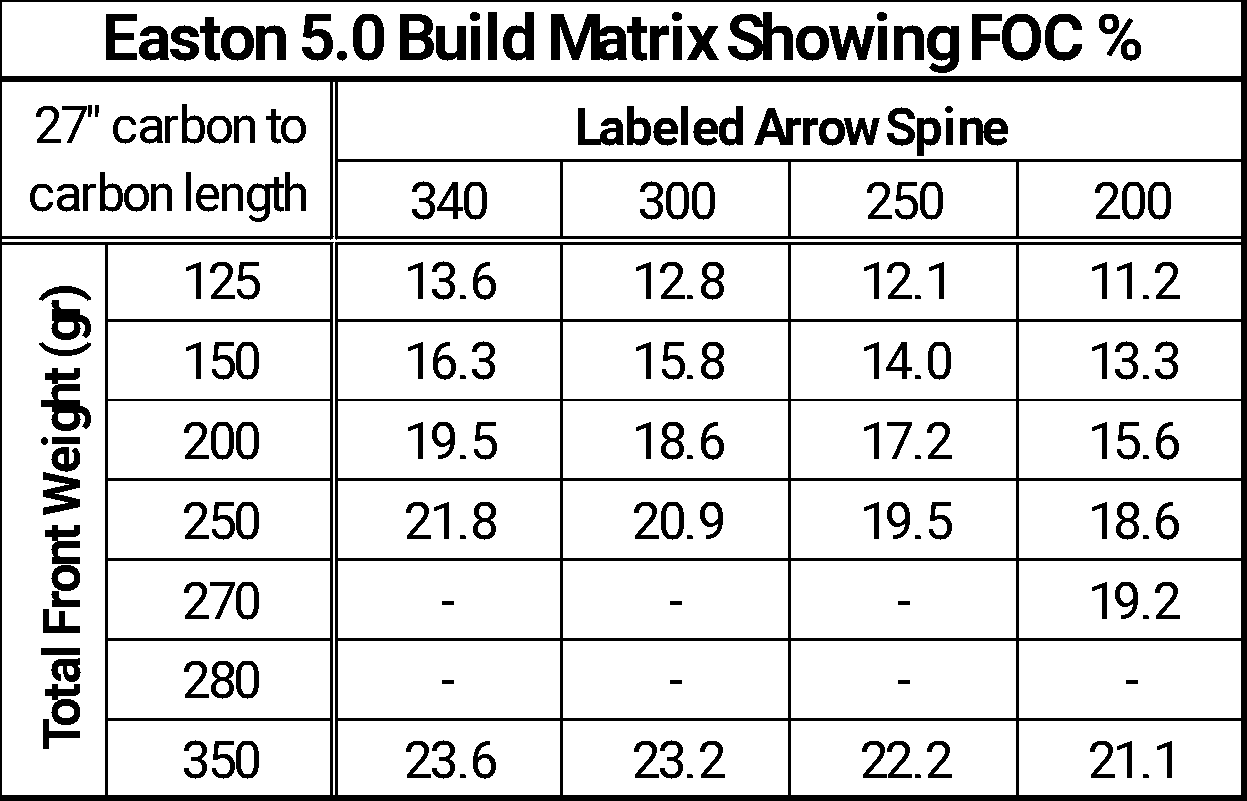
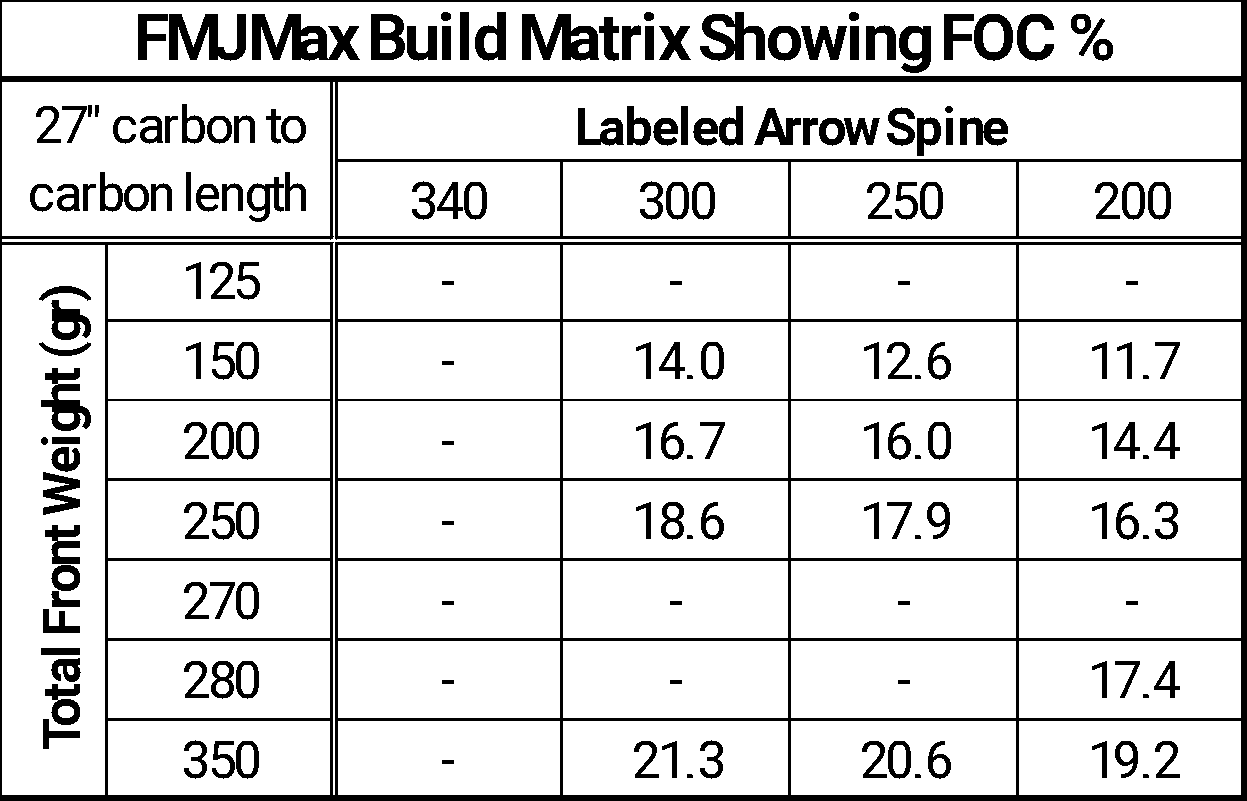
During the FOC testing we had two baseline arrow designs consisting of the Easton 5.0 and the Easton FMJ Max (340 to 200 spine arrows) and the following components:
1. Arrow: Easton 5.0 and FMJ Max
2. Arrow Length: 27” (carbon to carbon)
3. Insert: Easton 25 grain and 50 grain halfout inserts with Gold Tip screw in FACT weights (see arrow build matrices below)
4. Consistent vane configuration for FOC iterations: Three AAE Max Stealth, Bitzenburger Right Helical, 2° offset
5. Field Tip: 100 gr Gold Tip Ez-Pull Field Tip
6. Consistent fixed blade broadhead for FOC iterations: 100 gr QAD Exodus Full Blade
7. Standard speed bow: Hoyt AX-3 33 28” draw length and 70# draw weight
FOC Testing Background and Developing the Experiment Protocol
Front of center testing is a brand new experiment protocol for this year and it was a giant endeavor to accomplish. FOC is not an easy thing to test. It is nearly impossible to change FOC meaningfully without significantly affecting other aspects of the arrow. Since FOC is inherently a measure of the weight distribution of the arrow, lots of other things change when FOC changes. When you increase point or broadhead weight, total arrow weight increases, which reduces launch velocity. A change to a heavier point or broadhead will have implications on the center of pressure concept that was described above as well. Remember a bigger broadhead is going to pull the center of pressure forward and affect the stability of the arrow. Also, more majorly, as you increase point weight (holding static labeled arrow spine and length constant) the dynamic spine of the arrow weakens. Think about dynamic spine as how much the arrow is flexing coming out of the bow. Changes in dynamic spine can significantly affect accuracy and arrow stability. Also, like trying to quantify the aerodynamic lift recovery force, its very difficult to quantify dynamic spine reaction. Suffice it to say, we couldn’t simply set up an experiment to iterate on FOC while keeping EVERYTHING else constant.
Starting last fall Tristan and I began discussing how we could theoretically accomplish an FOC test. We came up with some loose concepts that could help us isolate the effects of just FOC in the post processing of data, but it would require a lot of time in the Easton Lab preparing and proving that it would work before the testing days. It would also require a lot of arrow builds, iterations, and ultimately looking a level deeper at the resulting data; looking at trends from a regression analysis. This concept revolved around building arrows according to an FOC matrix that iterates on labeled arrow spine (340-200) and total front weight (125 gr -350 gr). What this means is we weren’t going to rely on any previously developed spine chart, and we would be running all front weights on all spines. It would have been ideal if we could have done this for 4 or 5 different arrow models, but budget and schedule constraints dictated we could only do two different arrow models (Easton 5.0 and FMJ Max). Here are those build matrices showing the percent FOC for each build:
One key question was how to add the front weight to the arrow in the least impactful way. Fixing the center of pressure is an important control of the FOC study and how we add the front weight can affect this. We ultimately decided we had to add the weight internal to the shaft by screwing in Gold Tip FACT weights into the back of the insert inside the shaft.
Doing it this way, we could standardize on a single field point and broadhead for this experiment (we ultimately chose to use the 100 gr QAD Exodus Full Blade), which would fix the outside geometry of the arrow. This effectively holds the center of pressure constant for the arrow iterations in the FOC study (because the outside of the arrow remains identical). With the center of pressure fixed, we could rule out a change to center of pressure as a variable in our post processing of the FOC results.
The concept of the FOC testing is to break it out into two separate sections. The first is looking at the external ballistics effects of FOC. In other words, how FOC affects the trajectory, lift recovery, and accuracy of the arrows downrange at 70 yards. We would be analyzing arrow group sizes and relative impact locations with fixed blade broadheads and field points out of a tuned, untorqued bow, and then out of a tuned bow, but torqued 2 degrees (results in about a 0.9” paper tear at 15 ft) in the shooting machine consistently for every shot. The concept of the torqued and untorqued groups is a critical aspect of The Arrow Ballistics Study in both the lift recovery vane testing and the FOC testing. Since the shooting machine is far more perfect than a human shooter, this is our way of representing the human element. Looking at both torqued and untorqued groups collectively those groups are going to show how a human shoots with some variance shot to shot. Also, putting some stress on the system (imposing some angular deviation on the arrow) will better show how the arrow’s FOC and vane design affect the arrow’s lift recovery and aerodynamic jump.
The second concept of the FOC testing is done at short range using a high speed Phantom camera to slow down and watch the arrow’s reaction out of the bow using the same tuned, not torqued and then torqued philosophy. This is done to understand how the different FOC categories are affecting the initial reaction of the arrow out of the bow. By looking at the max yaw of the arrow (how cockeyed it is) and the max flex we could begin to understand how the dynamic spine of the arrow is changing as FOC changes, which is the most important aspect to decoding the effects of just FOC on downrange impacts. Pulling this sort of data from the high speed Phantom footage requires Python coding and program development that is quite challenging. As of the time of this writing, we are still in the development phase of this but we are getting it figured it out. More to come on this section of the study on my YouTube channel and at the PCA website.
Easton Lab To Do List
During the months leading up to the Study Testing days, which occurred on March 10-13th, I spent countless hours in the Easton Lab with the Easton engineers, actualizing the experimental protocols that we had theorized months before. We were cramming so much stuff into the 4 day Study event that everything had to be perfectly assessed, dialed in, and completely understood beforehand in order to come close to accomplishing it all in the 4 days of the Study.
- We assembled shafts and nocked tuned more shafts than I can count.
- Jace Johnson fletch all of the arrows.
- I tuned 4 different bows for all of the different arrow build categories. Every time FOC changed, the bow needed to be retuned with the Hoyt XTS system and tune position documented. The ease and speed of tuning with the XTS system was a critical aspect of the study. The tune location of each arrow build was documented so tuning during the study was really quick. I tuned bows with the XTS system easily over 100 different times for this study.
- We determined distances from the shooting that max yaw occurs for every arrow category (an aspect we needed to nail down for the Phantom filming).
- We dialed in the lenses, filming and triggering of the high speed Phantom camera. Huge thank you to Easton engineer, Dillon, for his killer work here.
- We iterated numerous times on the bow torquing mechanism to ensure 100% consistency shot to shot. We dialed this system in to yield exactly a 2 degree torque, which translated to about a 0.9” paper tear at 15 ft with our standard arrow build.
The Results
Here in Western Hunter, I am going to go over the results of this study, based on my interpretation for the western hunter. I am going to present these results in a question and answer type format. I’ll state a question and then answer it with a description and data from the test. And without further ado, the results:
Which were the most accurate broadheads at our standard speed (290 FPS)?
Quantifying broadhead accuracy was not a primary focus of the Study last year, so we decided to systematically include it this year. We didn’t go back and include the broadheads that we shot last year though, we only performed the testing around the broadheads we shot this year, so keep that in mind. Some of the broadheads we shot last year flew exceptionally well, like the Schwacker 261, Sevr 1.5, Thorn Rift 2.2, and Sevr 1.5 Hybrid. I have no doubt if we would have shot these broadheads again, they would have been right up there for tightest groups again.
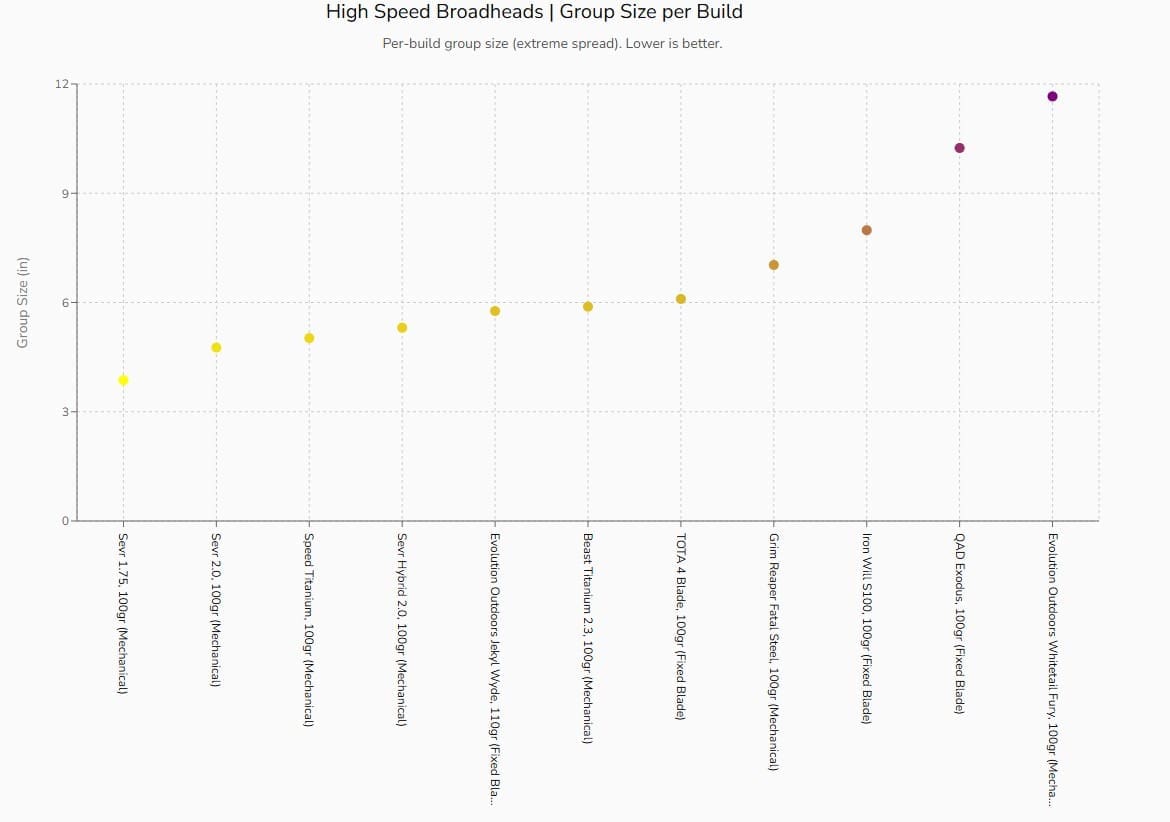
During the ballistics testing each broadhead was shot in groups of 6 arrows for 2 rounds with the baseline arrow build at a distance of 70 yards. The same baseline arrows were rotated through the broadheads to avoid any arrow biases. We performed broadhead group testing with the Standard Speed baseline (290 FPS). We also had a little extra time at the end to shoot some broadheads out of the high speed rig (325 FPS) to get an idea of how broadhead accuracy changes at higher speed. Photos of each group were taken, and the coordinates of each impact were analyzed to plot the metric. The plot below shows the group size (extreme spread) of each broadhead build. Remember the plots shown here are interactive on the Precision Cut Archery Website. You can hover over the dots to see additional data, and even click on the dots to see the photo of that particular arrow group. When you are done reading this article, you need to go check out the Study section of the PCA website.
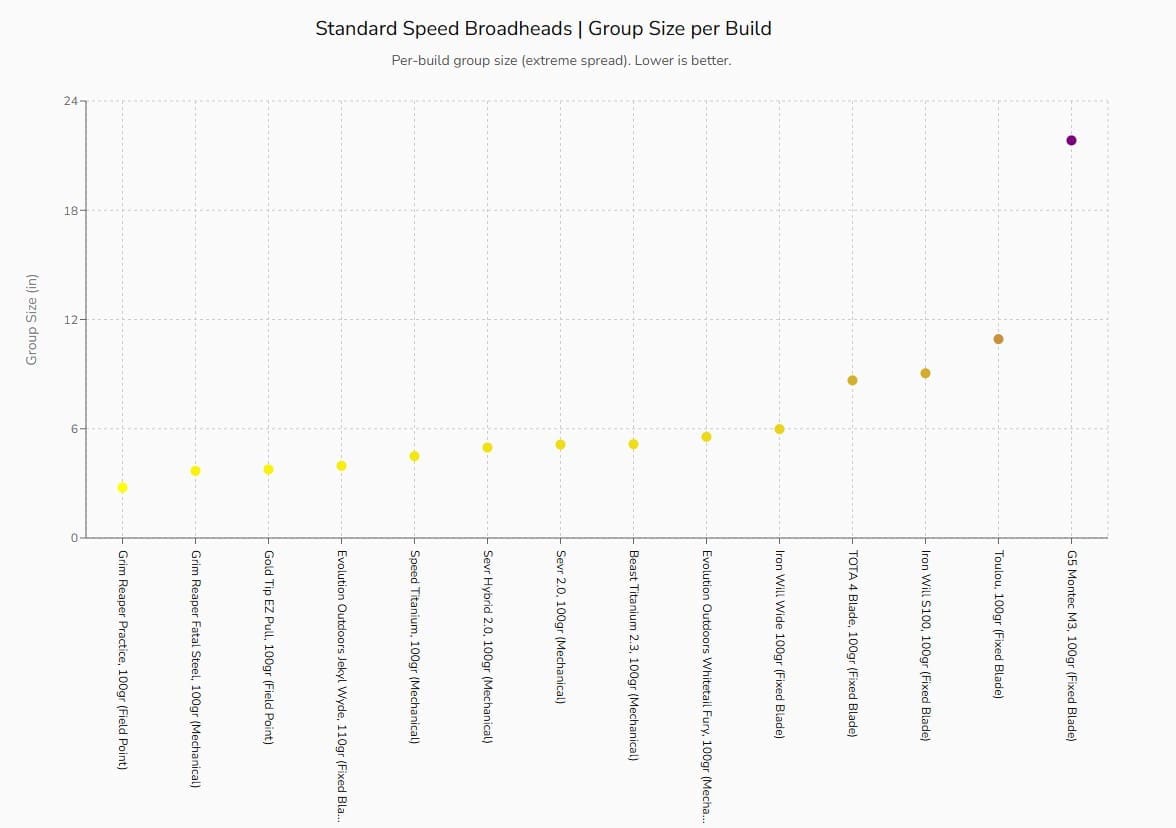
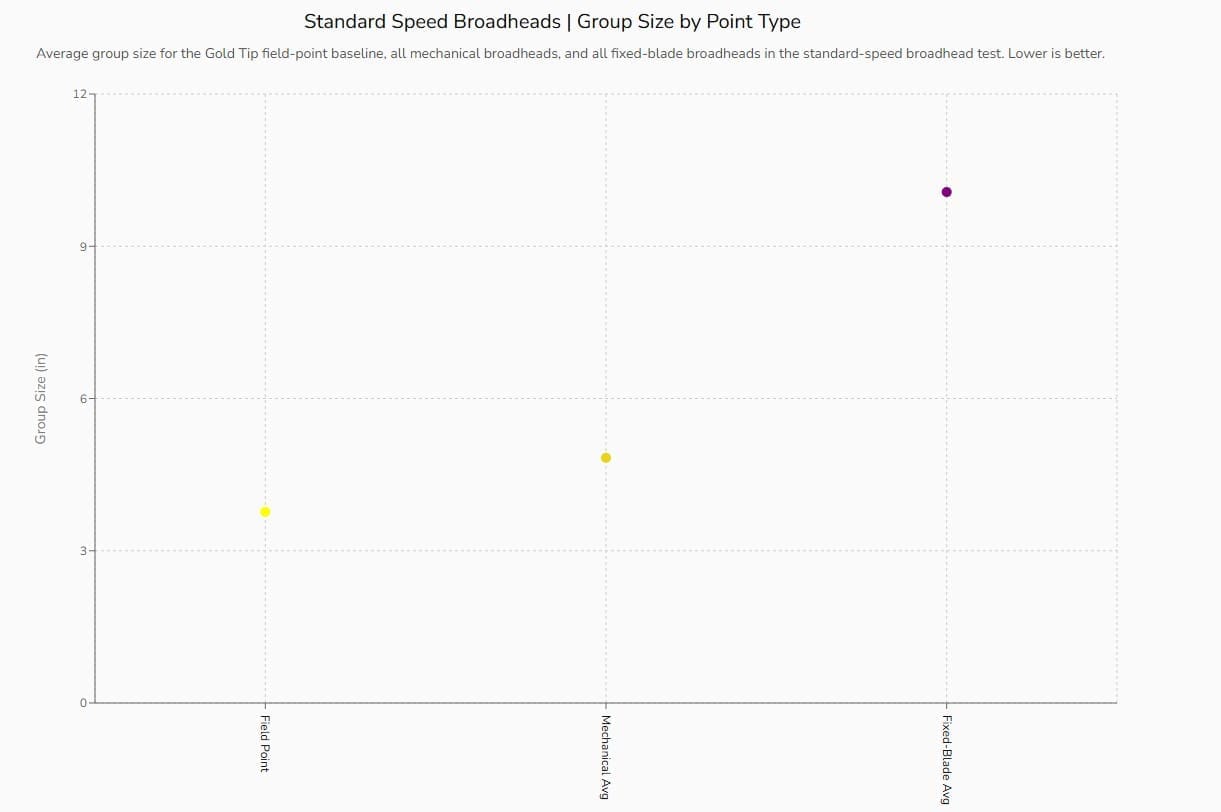
Just like last year, my biggest takeaway from the broadhead ballistics testing is just how much more forgiving mechanical broadheads are in flight than fixed blade broadheads. Remember though, this is an external ballistics only test, it doesn’t speak to durability, and terminal ballistics, which are very important parts of a broadhead that need to be considered outside of this study. Here is a plot showing the average field tip group size, mechanical group, and fixed blade group from the Study.
Which were the most accurate broadheads at our high speed (325 FPS)?
We also had time to shoot some broadheads using our high speed setup. This setup was launching arrows over 325 FPS. The plot below shows the high speed group size of each build. Note, several of the broadheads performed equally as well regardless of the speed. I was happy to see this because I am a fast arrow kind of guy. I’ve been shooting an arrow over 305 FPS to 315 FPS for over 10 years. A flat trajectory mitigating range finding errors is a huge attribute of an open-country, western hunting arrow.
Which were the most aerodynamic broadheads?
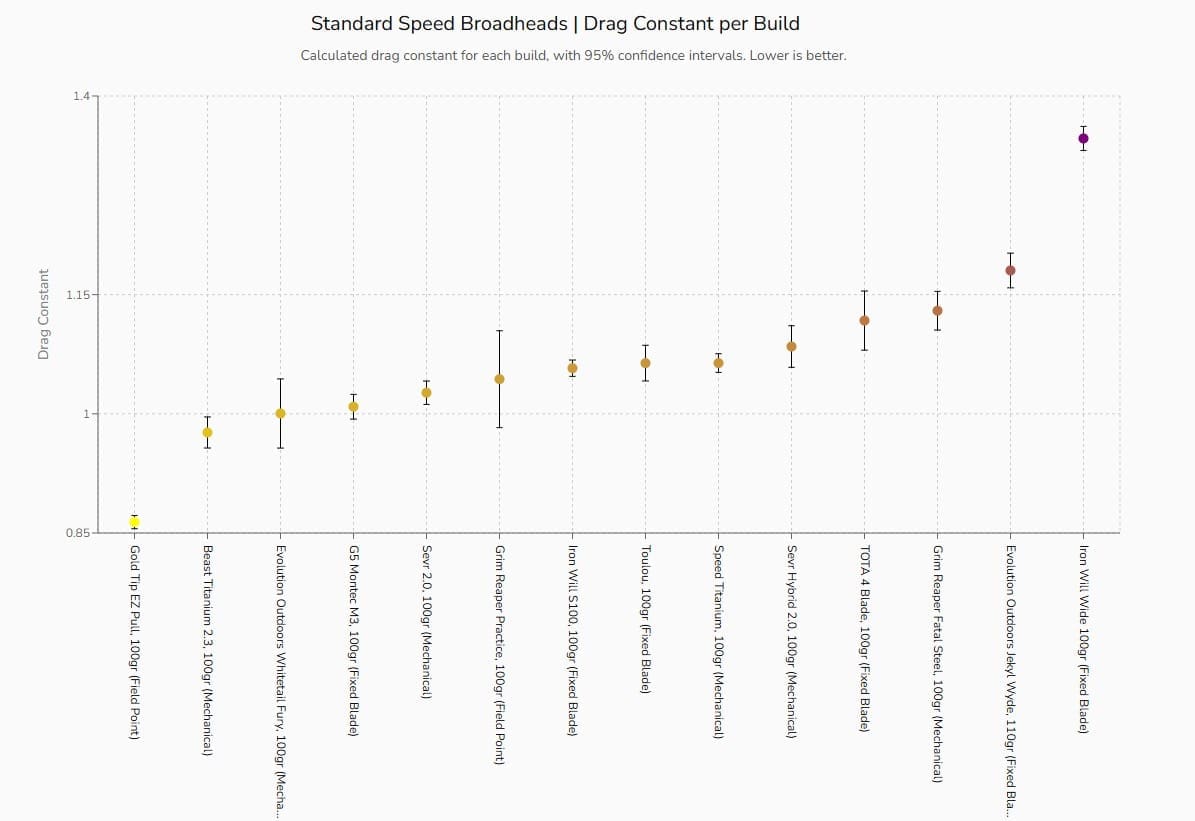
One of the major focuses of the study was to quantify drag coefficients for arrows tipped with different broadheads. To do this we used the baseline arrow build and shot every broadhead 12 times using Garmin Xero C1 Pro chronographs to capture launch and 60 yard velocities. We used PCA to calculate drag coefficients from these velocities. The following drag coefficients were calculated (smaller number means less drag, more aerodynamic). A lower drag constant means the broadhead-tipped arrow will drop less at distance and will drift less in the wind.
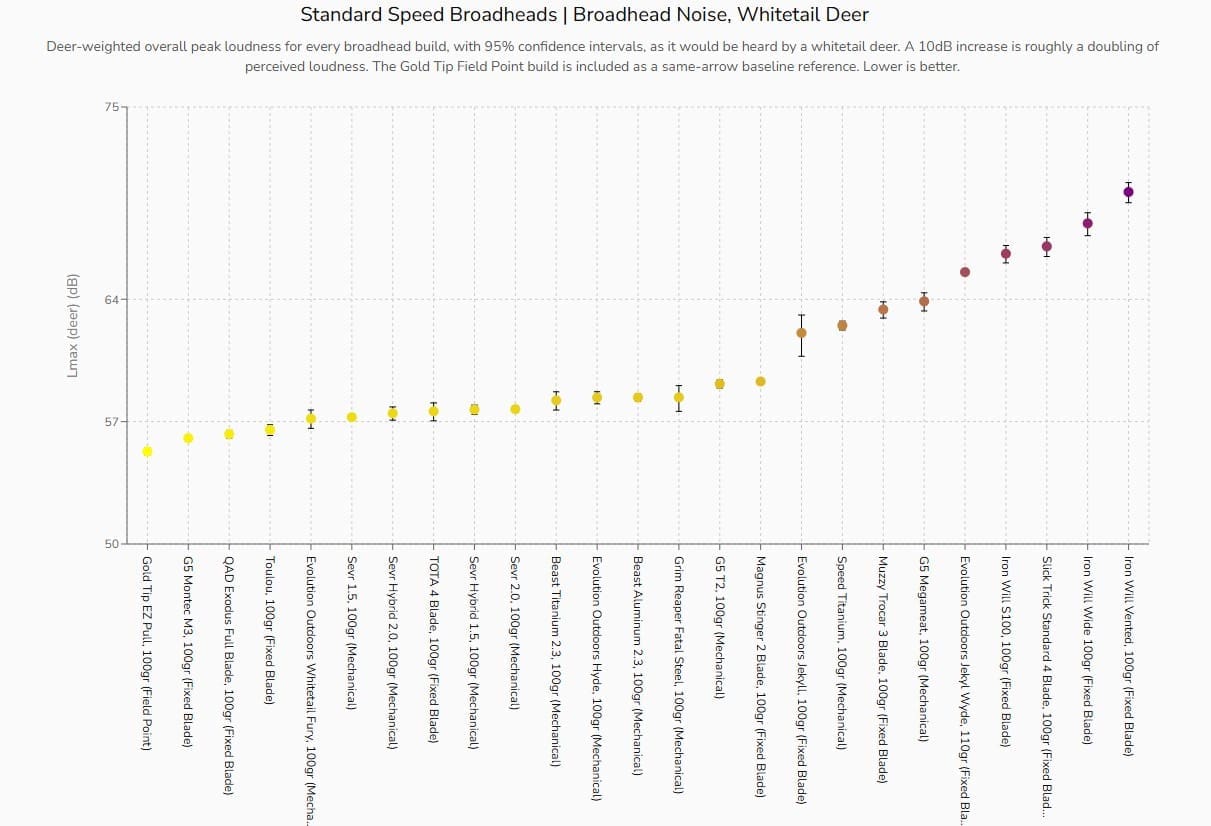
Which broadheads were the quietest?
This one is going to be a big hit. We did not have budget last year to conduct sound testing for broadheads, only the vanes. This year we had some, but it was limited. Sound testing was independently conducted by The Archery Sound Lab (see sound testing description above). We would have loved to test all of the broadheads from both the 2025 and 2026 Studies but unfortunately we couldn’t. We made a hybrid selection between the two Studies. The plot below shows the peak loudness in flight weighted for how a whitetail deer hears it (deer are more sensitive to higher frequencies). All of the broadhead tipped arrows were the standard speed baseline arrow. Remember that the decibel scale is a logarithmic scale (not linear), which means that a 10 dB increase on this plot is roughly doubling the perceived loudness. As expected, the loudest broadheads ae vented fixed blades followed loosely by mechanical broadheads that have a lot of surface area, cavities, or exposed blade. There is nearly a 15 decibel spread in loudness between these broadheads. That difference is nearly the equivalent of 3x (times) as loud.
I am a nut for a quiet arrow. I’m very confident in saying when a deer “jumps the string” that they are actually reacting to the arrow raging toward them rather than the bow going off, but that is a subject for a different article. I am far more concerned about building a quiet arrow than the general hunting industry. I have hunted and killed a lot of heavily pressured, public land, giant mule deer and I believe a quiet arrow has been a key to my success. Continue below to see how various vane configurations and broadheads mixed matched together change the sound response.
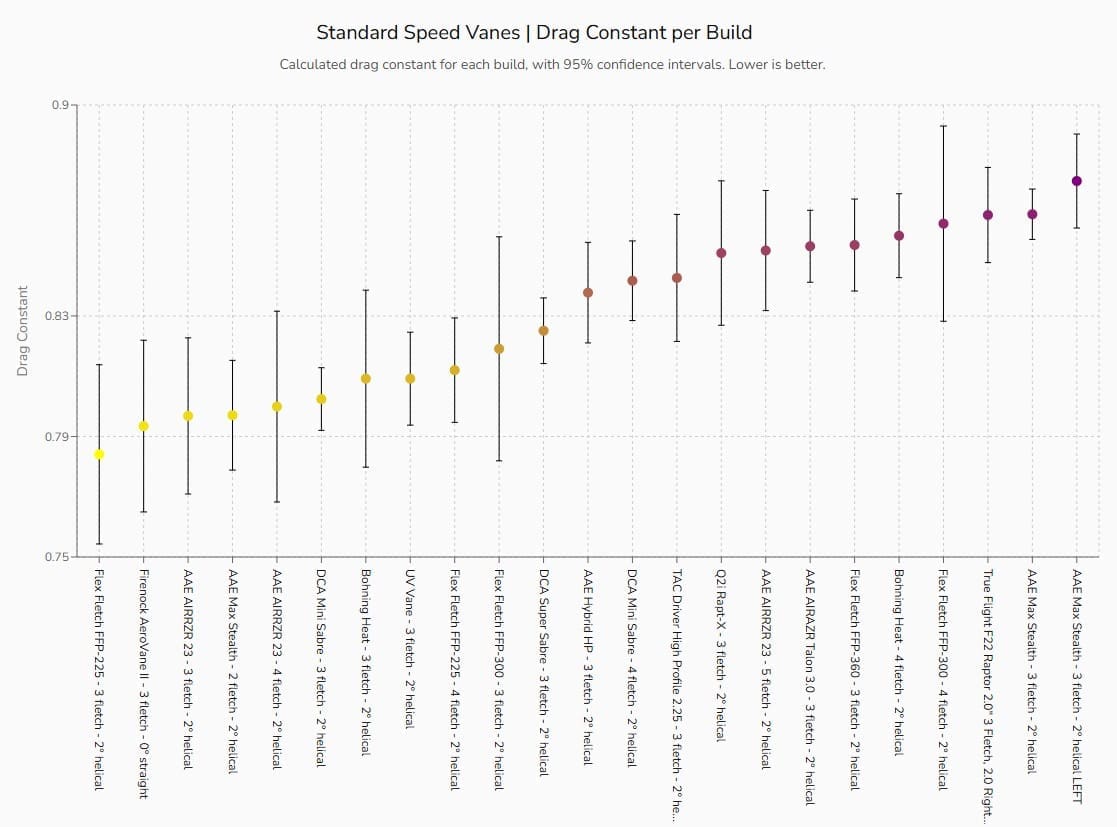
Which were the most aerodynamic fletching configurations?
This question is a little difficult to answer from a hunting perspective. Obviously, no vanes on the back of an arrow (or really small ones, like used in some field archery) would produce the most aerodynamic arrow build but this isn’t practical with broadheads. You need enough vane on the back of your arrow to quickly stabilize it with whatever broadhead you are shooting, otherwise it won’t be accurate. Nevertheless, here is the plot showing the drag coefficients calculated from shooting all of the fletching configurations with the control arrow build:
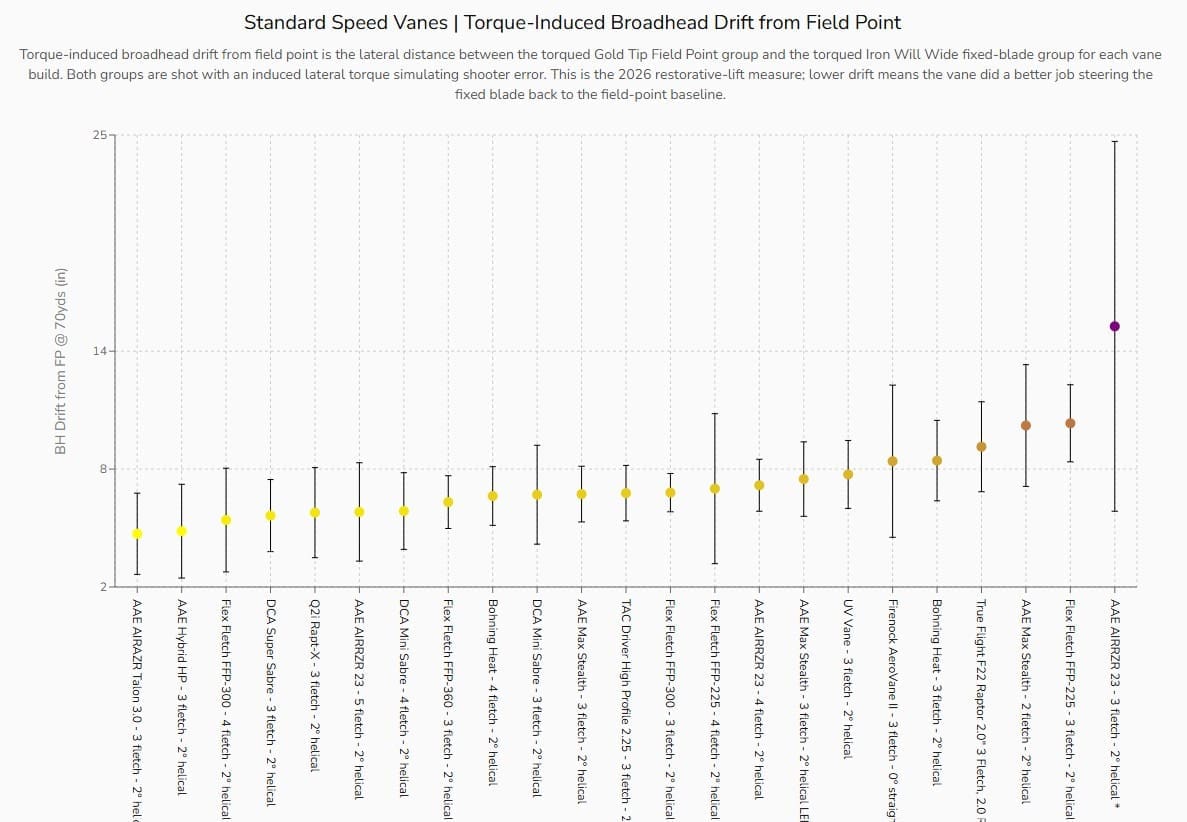
Which fletching configurations controlled broadheads best at our standard speed (290 FPS)?
This was one of the primary questions we set out to understand in this study with our controlled shooting machine. This is where the bow torquing protocol comes in. We torqued the bow consistently 2 degrees for every shot. We shot field tips and Ironwill Wide broadheads for every vane configuration and measured the lateral distance between the two groups. Under the torqued condition they obviously did not land in the same spot. We included some of last year’s vanes with the new set of vanes for 2026 to set a familiar baseline. The smaller delta between the two groups means the vane is doing a better job of keeping the broadhead tipped arrow in control relative to the field point arrows. Here is a plot showing the results.
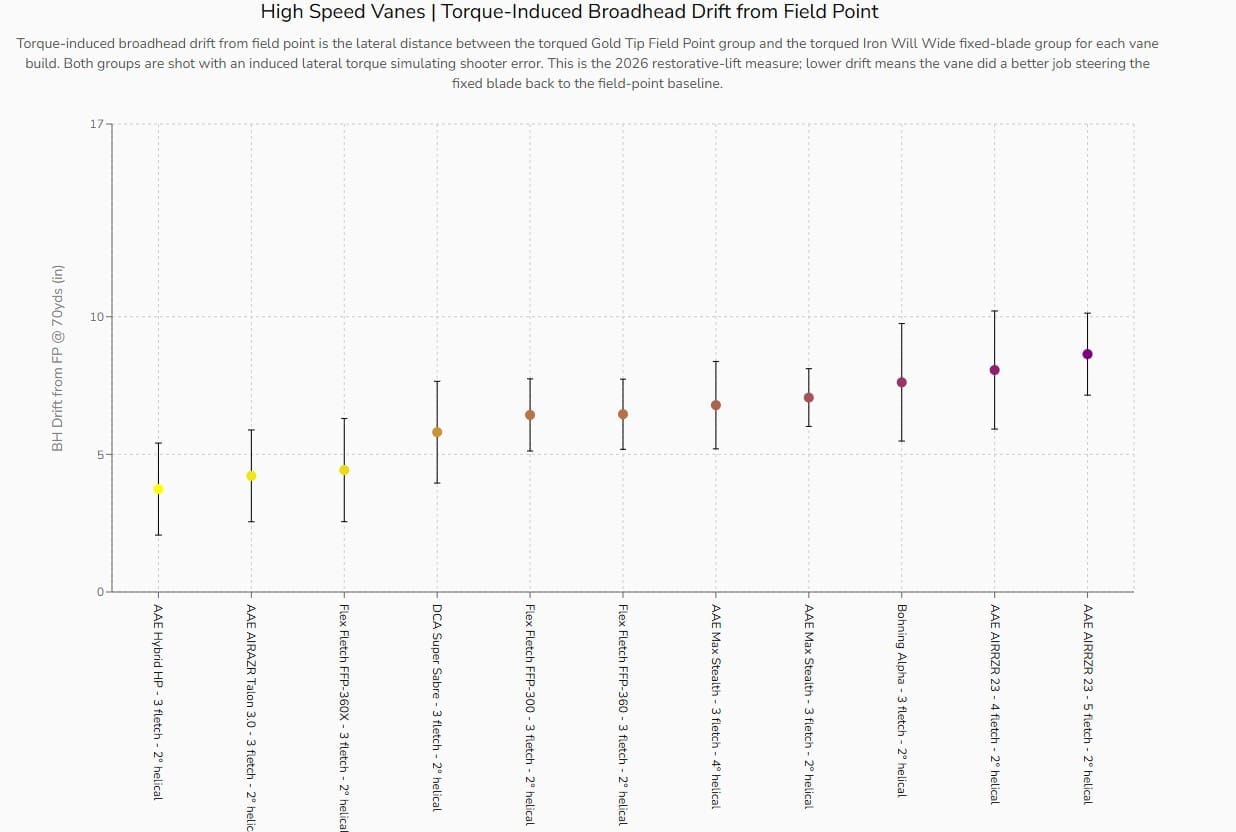
Which fletching configurations controlled broadheads best at our high speed (325 FPS)?
We also had time to run some vane configuration iterations through our lift recovery protocol using our high speed setup and the Ironwill Wide broadhead. This setup was launching arrows over 325 FPS. The same protocol defined immediately above is used, except for using the high speed baseline.
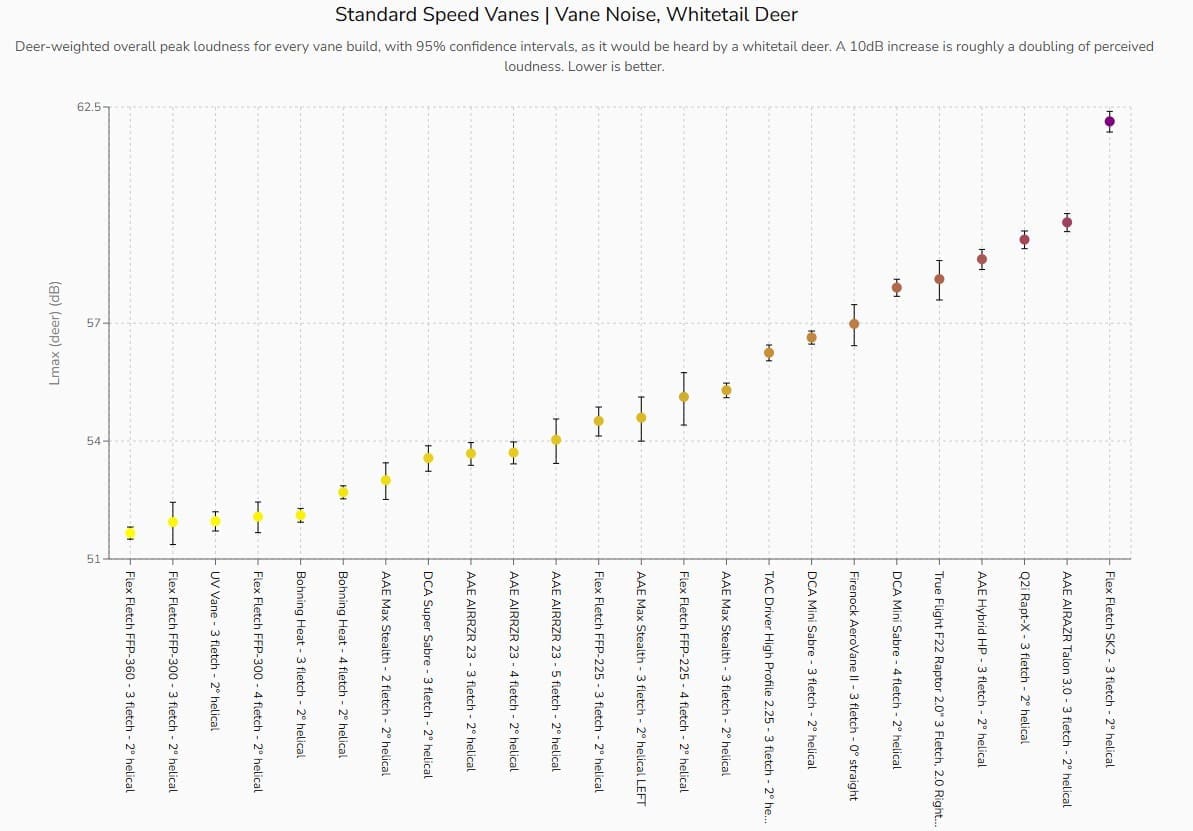
Which vane configurations were the quietest?
Again, arrow noise is a big deal to me. This is an important plot for me. Sound testing was independently conducted by the Archery Sound Lab using a purpose built sound chamber (see sound testing description above). The plot below shows the peak loudness in flight weighted for how a whitetail deer hears it (one octave higher than humans). All of the arrows were tipped with the Gold Tip Ease Pull field tip. Remember when looking at this plot that the decibel scale is a logarithmic scale (not linear), which means that a 10 dB increase on this plot is roughly doubling the perceived loudness. Some repeats from last year’s testing were mixed in for a familiar baseline. The gradual profile and thinness of the Flex Fletch 360 and 300 vane are still topping this chart. The UV vane and Bohning Heat also performed very well. Note the scale here, the Flex Fletch SK2 is over twice as loud as the Flex Fletch 360.
Does vane noise matter once you screw on a broadhead?
Lots of people reached out to me last year after the results released and said vane noise doesn’t matter once you screw on any broadhead. I disagreed with them because that is not what I have seen in my personal testing. I deliberately pair a quiet broadhead with a quiet vane on my personal setup and the result is a quiet arrow. Reminder, arrow noise is a big deal to me and has been a major focus of my arrow setup for a long time. So, for 2026 I wanted to formally test it. We took the quietest vane (Flex Fletch 360) and paired it with a few different fixed blade broadheads (Toulou, Slick Standard, and Ironwill Vented) on both ends of the spectrum (quiet and loud), and then the loudest vane (Flex Fletch SK2) and paired it with the same broadheads. We compared all of these together with the standard baseline measurements to understand vane noise versus broadhead noise.
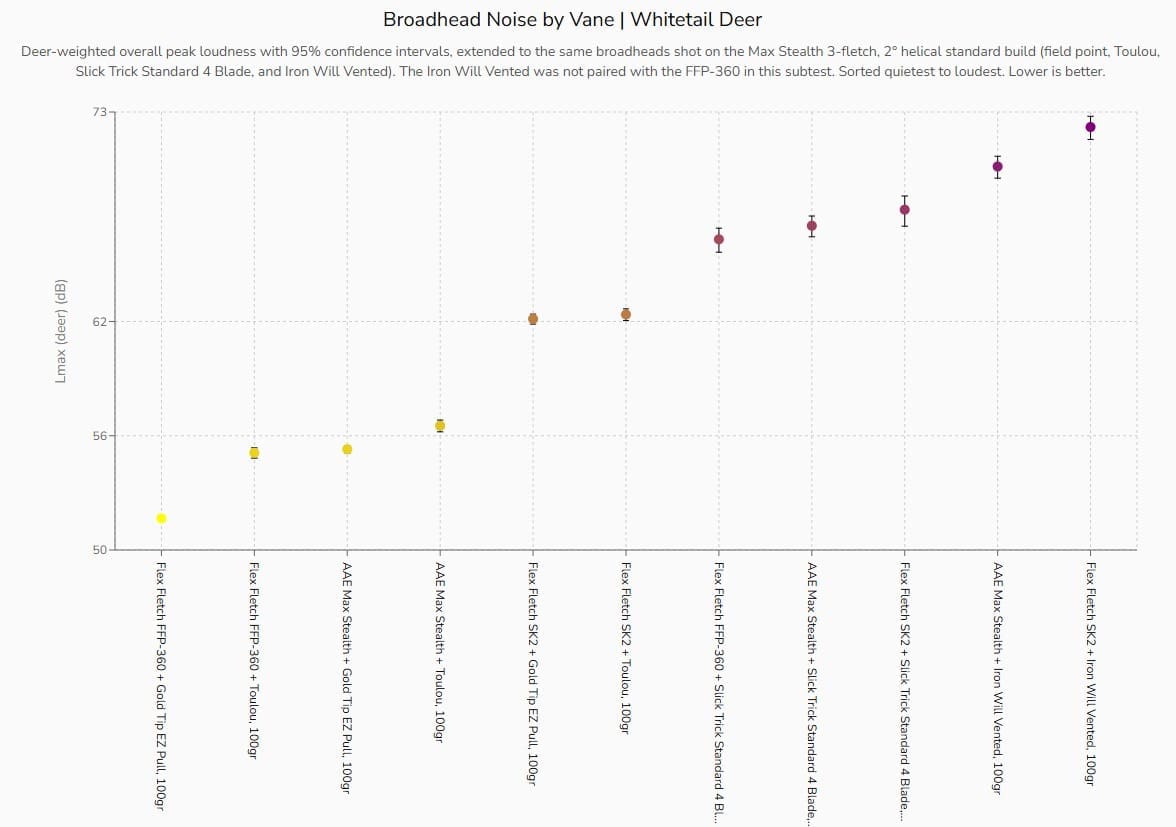
Would you look at that, apparently vane noise does matter! The 360 paired with the Toulou (which wasn’t even the quietest broadhead) is the second quietest setup on this comparative plot, even quieter than the Max Stealth and field point combo. It’s also 7 dB quieter than the SK2 field point combo. That’s huge considering 10 dB is a doubling of perceived loudness. All kidding aside, I do not deny that a loud broadhead will dominate the sound profile of the overall arrow. For example, the difference between the 360, Max Stealth and SK2 when paired with the Slick Trick Standard is only 1.6 dB. That is a giant reason why I don’t shoot loud broadheads. However, it is quite clear from this plot that a quiet broadhead paired with a quiet vane will yield a quiet overall arrow. Even if you scroll up and look at the broadhead noise testing again, several mechaincals performed nearly as well as that Toulou, including Sevrs, Evolutions, and Beasts. Any of these mechanicals when paired with a quiet vane will produce a quiet overall arrow.
As I said above, arrow noise is a critical factor for me. To me, it’s way more critical than the sound of the bow going off. The sound of a bow going off is an extremely short, noncontinuous sound that sounds similar to a stick breaking in the woods. There is no doubt animals hear it but it’s not as threatening as the high frequency hissing sound of an arrow coming straight at them. An arrow’s hiss is completely unnatural sounding and is a continuous noise that they can literally track getting closer to them. Their instinct is to react to any threat that is getting closer to them. It’s the sound of the arrow that they are reacting to when they “jump the string.”
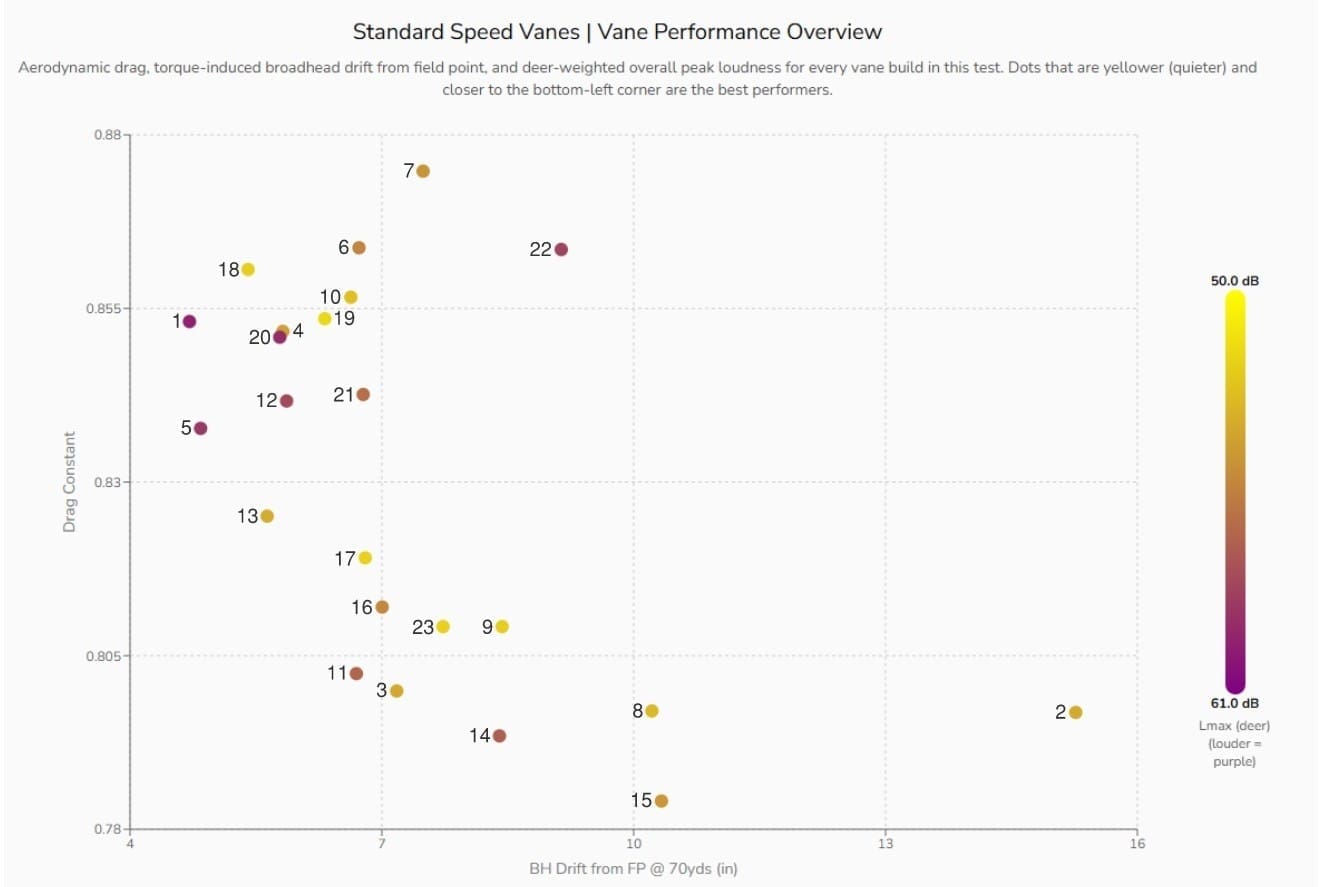
Which fletching configurations had the best combination of drag, lift recovery, and quietness for you?
This is undoubtedly the single most important and frequently asked question about this component Study. Unfortunately, it’s not the most straight forward for me to answer for YOU. Having enough vane on the back of your arrow is essential for stabilizing the arrow quickly, but too much vane can increase drag, which will slow your arrow down and cause more wind drift. For a western hunter, maximizing the flatness of your trajectory is a very important aspect of setting up your bow and arrow. If you’ve spent any time following me, or my articles, you know I preach the importance of range forgiveness for western hunting. The most common mistakes in western hunting revolve around miss ranging (even with a range finder) so designing your arrow to mitigate this is so important. Having a flat shooting arrow really promotes good range forgiveness. So, there is a balance that needs to be met when designing your arrow between lift recovery and drag. That balance is highly dependent on what broadhead you are shooting; how tuned your bow is; and how well you, individually, are able to shoot in the heat of the moment with potentially awkward angles or bad footing. You have to be very real with yourself and your shooting ability to answer this question. You essentially want to shoot as little vane as you can get away with knowing your own shooting abilities in the heat of the moment. For example, you can get away with significantly less fletching when shooting a low profile, good-grouping mechanical broadhead, but for fixed blade broadheads, even for very experienced shooters, having enough vane is important to counteract any planing of the broadhead. Even if you are shooting a mechanical broadhead but you know you tend to rush or pull a shot in the heat of the moment, you need to design your arrow with more lift recovery (vane).
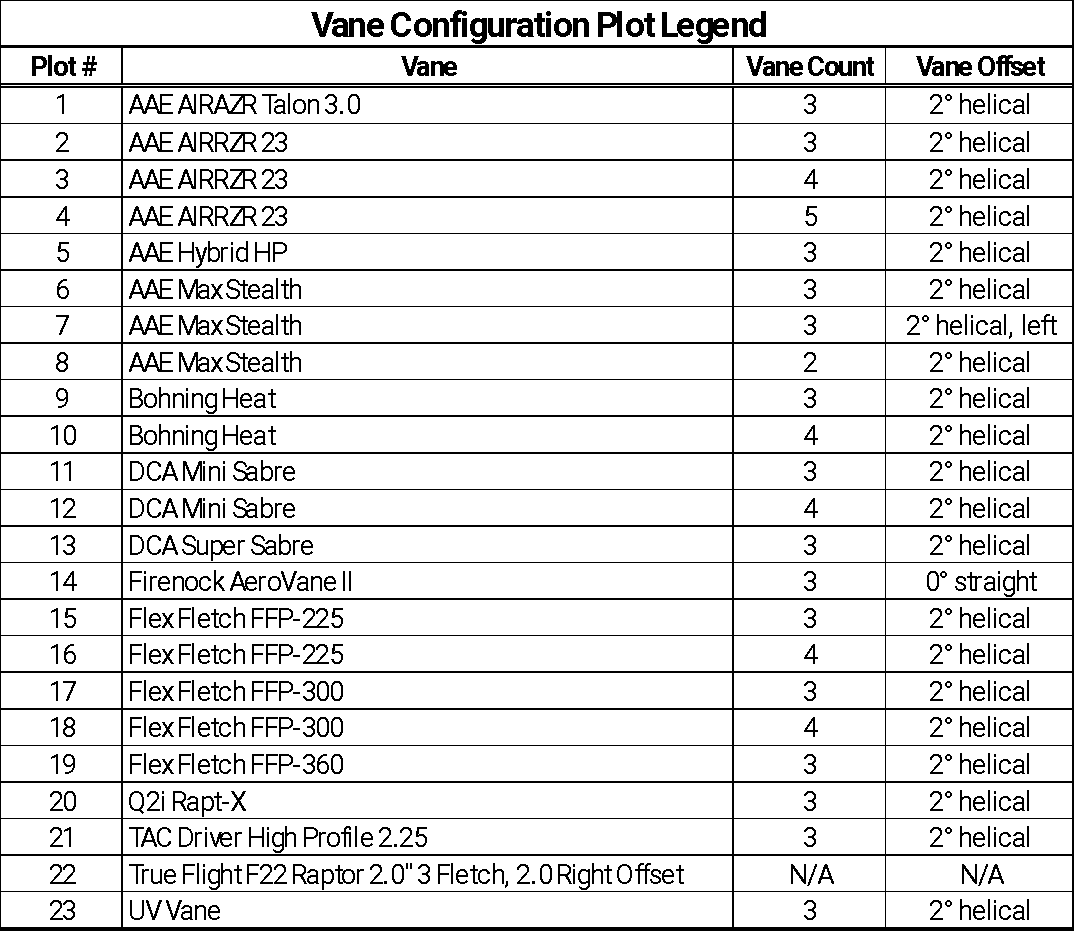
All that doesn’t even consider how quiet the vane is and as we learned in the question above, vane noise certainly matters and needs to be a big consideration as well; at least it I for me. The plot below simultaneously shows these three metrics for all 23 fletching configurations tested in the 2026 Study. Those metrics are drag constant on the vertical axis, lift recovery (broadhead drift from field point at 70 yards) on the horizontal axis, and then each dot is colored by peak loudness (deer weighting). The more yellow dots are quieter and the more purple dots are louder. This one plot pretty much summarizes the vane testing. This is a plot you really need to check out on the Precision Cut Archery website, once you’ve finished reading this article. The interactive nature of the plot on his website makes it much easier to read.
Okay, so what is the best FOC?
The short answer is more FOC is better especially for broadhead group accuracy (inside the bounds of appropriate dynamic spine, and trajectory of your arrow). We saw some instances where increasing FOC reduced broadhead group size in half. The caveat is the study did not find an inherent sweet spot for FOC (and one might not even exist). Meaning we didn’t see broadhead group size hit a minimum at a certain percent FOC and then group size increase after that. What is logically going to set the upper bounds on increasing FOC is the dynamic spine of your personal arrow (which is influenced by your drawlength and draw weight as well), and your desired trajectory of your arrow. For example, a flat shooting arrow, or flat trajectory is still very important to minimize range finding errors for western hunters. The study found that increasing FOC efficiently can significantly decrease broadhead group size. The key is increasing FOC efficiently; simply throwing a bunch of point weight on the end of your shaft could actually hurt you more than help you, though.
The long answer. The new test program that we developed for this year is front of center testing. If you skipped right down to the results section of this article (I know lots of you did LOL!), you absolutely need to scroll back up and read the FOC section of the How the Study Was Conducted section, otherwise none of this is going to make any sense.
For each arrow FOC category in the FOC arrow build matrix, the bow was tuned for that exact arrow design. After tuning, 6 field point arrows were shot and 6 fixed blade broadhead arrows (QAD Exodus Full Blade) were shot at 70 yards with the bow untorqued. Immediately following, the bow was consistently torqued 2 degrees in the shooting machine and the 6 field point arrows and 6 broadhead arrows were launched at 70 yards. Then the sequence started over with a new arrow FOC category, starting with the retuning of the bow.
From these downrange groups, we are able to analyze the follow metrics:
- Broadhead group size (or mean radius to be more statistically kosher) from a tuned bow, untorqued.
- Broadhead group size (or mean radius to be more statistically kosher) from a tuned bow, torqued consistently for every shot.
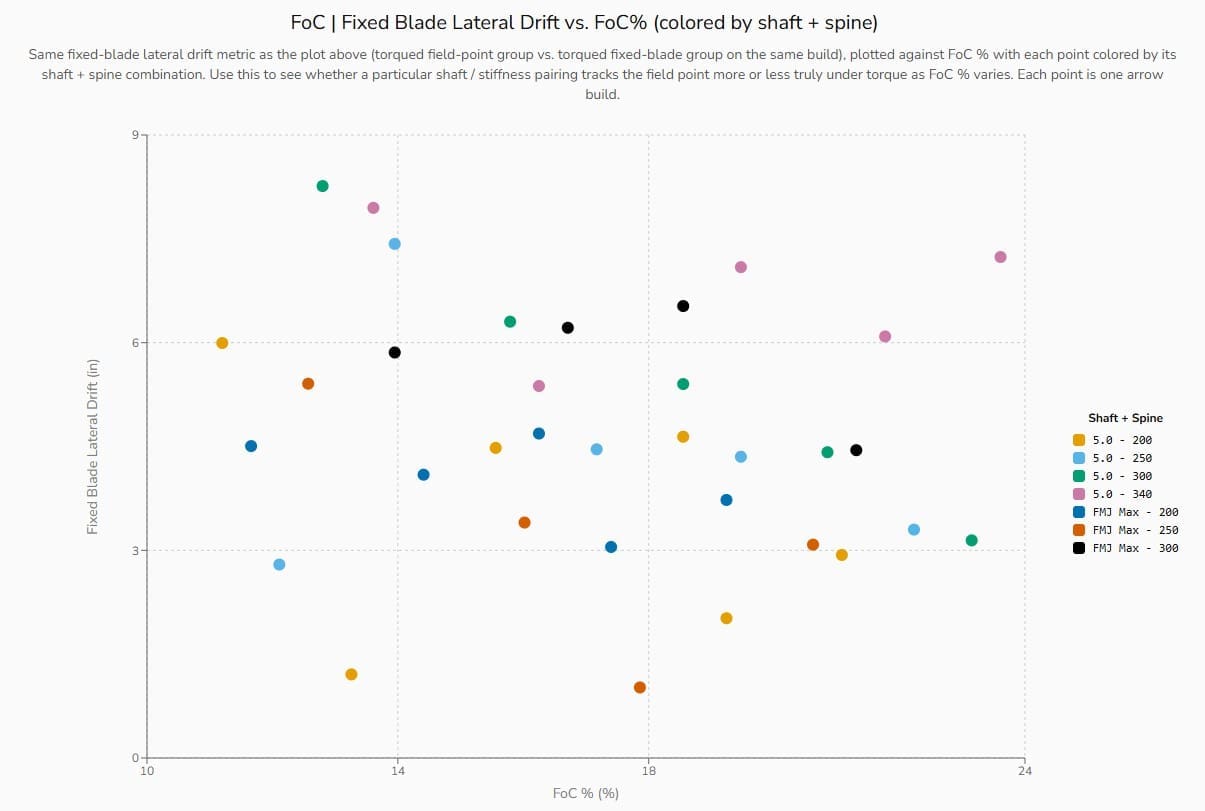
- Broadhead drift past field point (comparing torqued broadhead arrow impacts and torqued field point arrow impacts), which is the same metric used in the vane lift recovery testing.
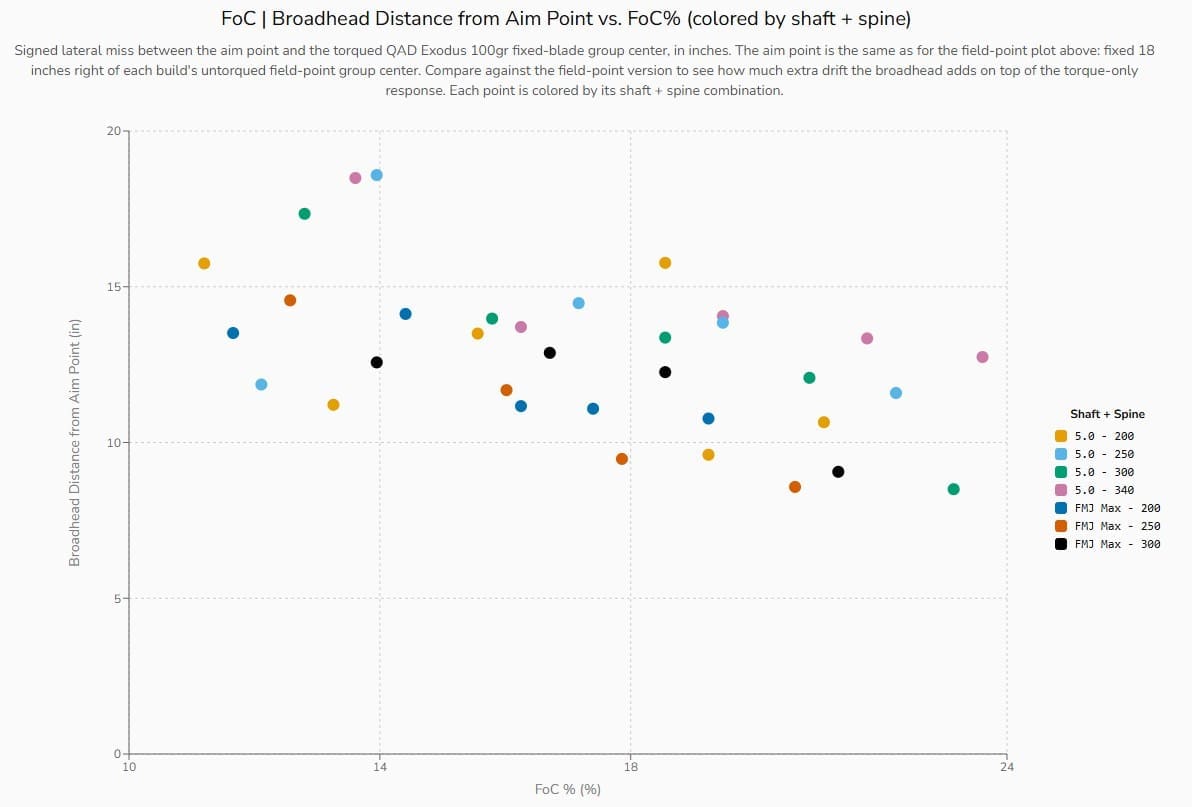
- Broadhead drift from aim. This new metric measures how far away from the aiming point the torqued broadhead group landed. It is a measure of how far the shot missed the intended aiming point because of the torque.
As I discussed in the FOC methodology section above, when we change FOC for each arrow build other things are changing simultaneously with FOC like total arrow weight, launch velocity, and dynamic spine. So, when we look at a plot of FOC versus one of the metrics above (say broadhead group size) who is to say that broadhead group size is really changing because of the FOC change and not because of the simultaneous velocity change? That can’t be answered by simply looking at a scatter plot.
The answer to solving this dilemma is called a regression analysis. Regression analysis is a powerful statistical tool used to model the relationships between commingling variables. It identifies how a single metric outcome like broadhead group size changes when one or more variables change, like FOC, launch velocity, etc. In this case we want to see how the metrics above (broadhead group size, etc.) change when the variable FOC changes while theoretically holding the other variables constant in the model space (like dynamic spine, total arrow weight, and launch velocity).
This is exactly why we developed the big FOC matrix for this study. We were able to use all of the applicable data simultaneously in this regression analysis to help us understand which metrics are meaningfully changing because of FOC alone. Holding all other identified variables constant in the regression (launch velocity, dynamic spine, etc.), how does changing FOC alone impact broadhead group size?
The math behind this analysis is beyond the scope of this article, but for the nerds out there like us that want to chew on it, the FOC methodology section on the PCA website has it all. Go geek out to your heart’s content.
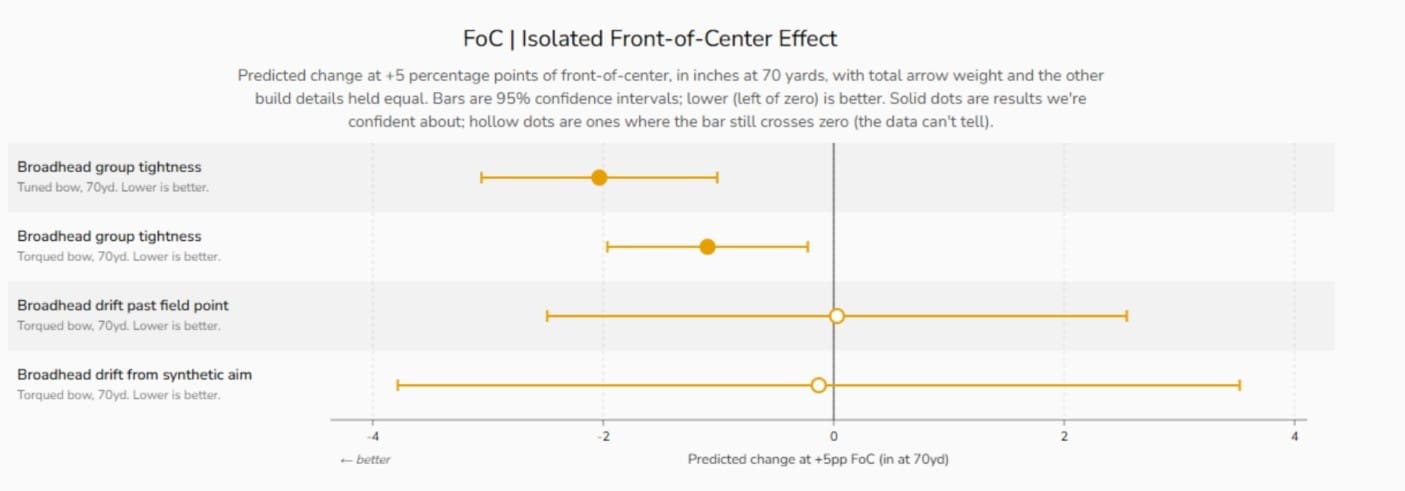
The chart below shows the outcome of the regression analysis looking at how each metric changes when FOC is changed and all other variables are held constant in the model. Since this is a regression result it’s just one point of change for the metric. The dot is the value of the predicted change for that metric when FOC is changed 5 percentage points (15% to 20% for example). It’s not actually as complicated as it sounds. Let me walk you through an example.
That first row is the metric broadhead group tightness at 70 yards (tuned, untorqued). So we essentially asked the regression, what happens to broadhead group tightness, if FOC is changed 5 percentage points? You can see that the dot is at -2 inches on the scale. This means that the regression predicts that broadhead group tightness improves 2 inches (group mean radius gets 2 inches smaller) when FOC is increased 5 percentage points and all other variables are held constant. The bars that you see extending from the dot are the statistical 95% confidence intervals (we are 95% certain statistically that the real answer with a much larger sample size is between those bars).
For broadhead group tightness from a torqued bow the regression also shows an improvement of about 1inch on the mean radius when FOC is increased 5 percentage points.
For both metrics “broadhead drift past field point” and “broadhead drift from aim” the circles are pretty much right at zero. You’ll notice that the confidence bars are quite large on these metrics as well. The interpretation here is that the regression is inconclusive with these metrics. There isn’t enough data for the regression to accurately say if these metrics are changing because of FOC or some other variable like dynamic spine or velocity. This is where a bigger FOC matrix with more shaft families (with different grains per inch) would be helpful. Iteration on arrow length could also help since total arrow length affects FOC, dynamic spine, and velocity and would give the regression more data from other relationships to chew on.
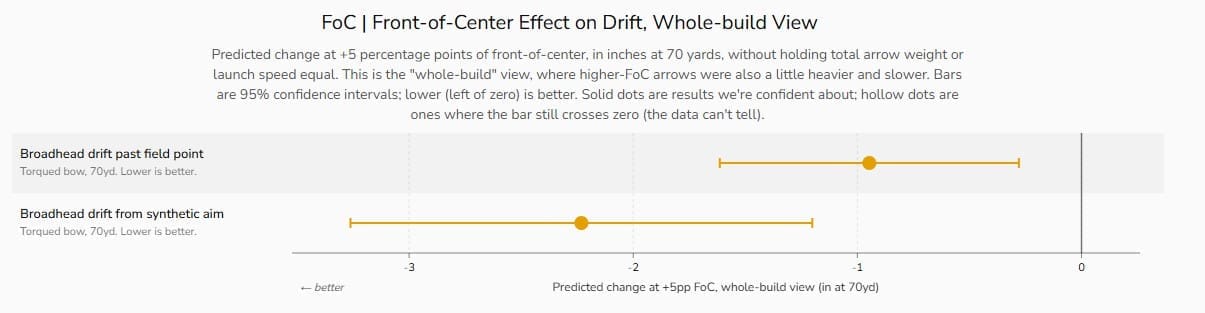
Now diving into those drift metrics some more. The next plot shows the results of the regression if we let the arrow weight and launch velocity naturally change with the FOC changing. So those variables simply are what they are for each arrow FOC category. If FOC is increased 5 percentage points, the regression predicts a decrease in broadhead drift past field point of 1 inch (an improvement). It also predicts that the torqued broadheads will land more than 2 inches closer to the aim point (a big improvement).
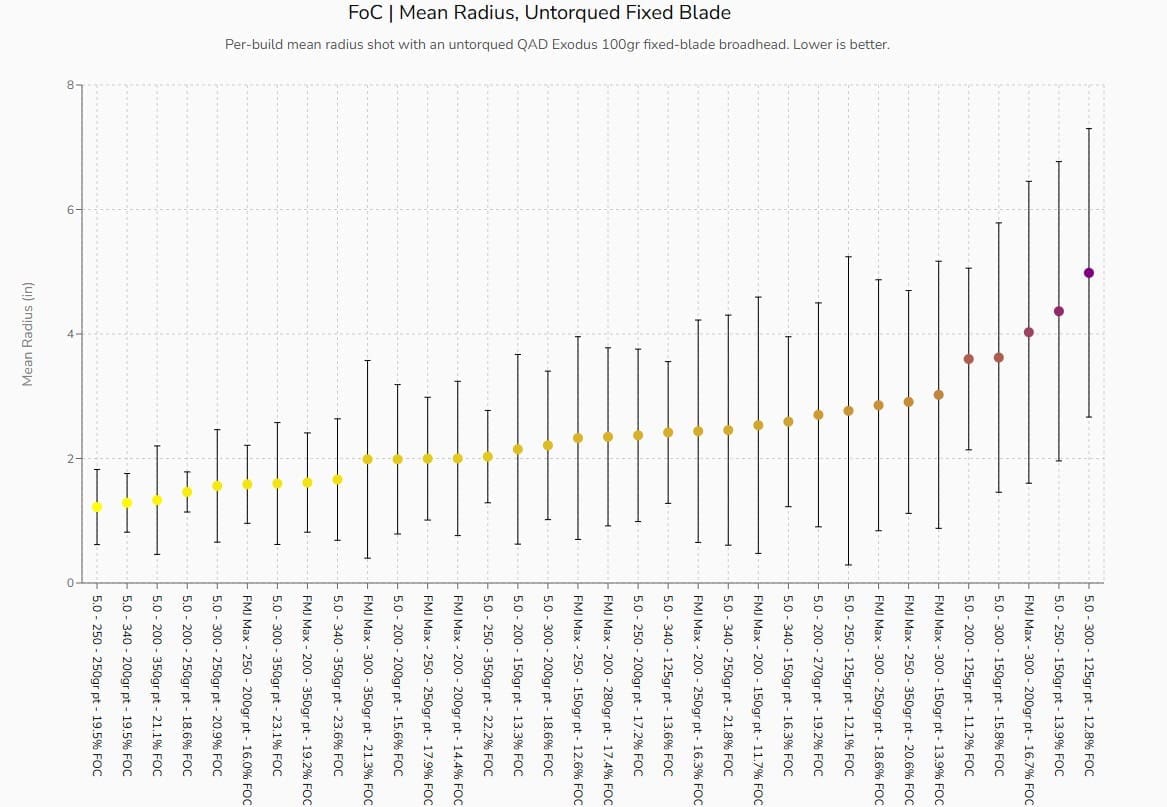
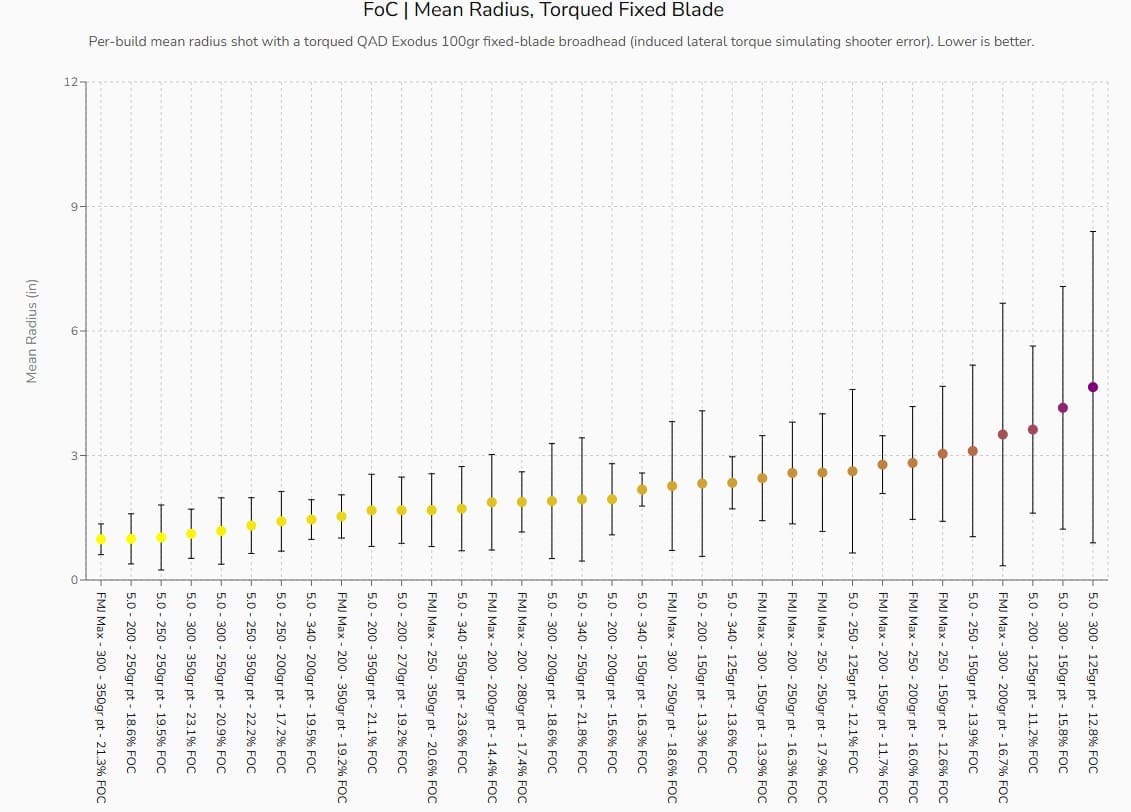
Do you want to see the Raw FOC results (caution)?
Here are the raw results plots for each of the 4 FOC metrics we’ve been talking about. This is some of the data that was feed into the regression analysis. I caution you that simply looking at these charts for the best FOC’s corresponding to the best/lowest metric values is not a best practice because it may not be FOC alone contributing to that metric. I have studied these plots a great deal and there are some trends that you can point out that support the results of the regression. This is beyond the scope of this article however and will be much easier to explain and show on an upcoming YouTube Video on my channel (Yates in the Backcountry).
What is the practical application of the FOC results?
I know this FOC section is a bit more complicated than the other metrics that we tested in this study. It’s easier to explain on a YouTube video than in an article. FOC is a complicated thing, but there are still some very clear take aways from these results. The regression clearly predicts that increasing FOC will decrease broadhead group size meaningfully. The caveat is the model didn’t predict a sweet spot FOC, per say. What is logically going to set the upper bounds of increasing FOC is the dynamic spine of your personal arrow (which is influenced by your drawlength and draw weight as well), and your desired trajectory of your arrow. For example, a flat shooting arrow, or flat trajectory is still very important to minimize range finding errors for western hunters. These will set the upper bounds of FOC naturally.
Things to consider when building arrows and targeting more FOC while keeping your arrow weight the same:
- Cut your arrow as short as you are willing to go and then maintain the same total weight by adding the removed shaft weight to the front (cutting your arrow shorter will increase the dynamic spine reaction also).
- Move to a lower GPI shaft and put the weight savings from the shaft into the front (don’t push adding point weight too hard though, you still want to respect the spine chart).
- Use the vane analyses from this study to pick a new lighter weight vane that steers equally as well.
Conclusion
The Arrow Ballistics Study was a huge success. We captured a ton of very meaningful data that have answered a lot of my own questions, and I know will answer a lot of questions for many of you. The study has also opened the door to new questions I am curious to test. We’ve already got big plans in the works for the 2027 Arrow Ballistics Study.
There are a lot more questions that could be discussed about this study than I have included here, but I needed to start and stop somewhere and get some results out on the street before I started getting death threats LOL. This article just touches the surface as far as results go, giving you a lot of the high level data (for you to think about), and there are a lot of deeper interpretations and conclusions that can be made beyond what I’ve discussed here. Check out my YouTube channel @yatesinthebackcountry where a lot of additional information and analysis about this study will be covered. You really need to do yourself a favor and go check out the results webpages at Precision Cut Archery. Tristan has truly done some incredible work organizing all of these results for your viewing and learning pleasure.
To close, I just want to give another shoutout and thank you to the team, Tristan at Precision Cut Archery, Easton, Hoyt, Jace Johnson, and Archery Sound Lab for helping me accomplish this study. It takes one person to have an idea but a solid team to undertake a study of this magnitude. One more big thank you to our sponsors as well! We’ve only scratched the surface as far as things to learn and explore and I cannot wait to continue this effort for years into the future.